
Collecting a Performance Monitor Data Collector Set for Root Cause to find or to Isolate the exact scenario to proceed further
For troubleshooting a high CPU issue, we need to collect a data collector set. To create a data collector set for troubleshooting high CPU, follow the steps as shown below:
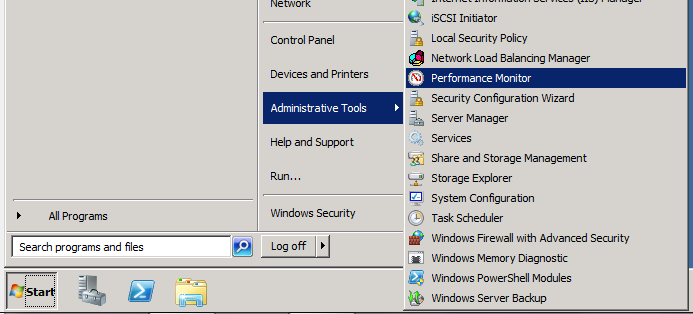
1: Open Administrative Tools and select Performance Monitor as shown below:
2: Double-click on Performance Monitor.
3: Expand the Data Collector Sets node.
4: Right-click on User Defined and select New, Data Collector Set.

5: Enter High CPU as the name of the Data Collector Set.
6: Select the Create Manually (Advanced) radio button.
7: Click Next.

8: Select the Create Data Logs radio button.
9: Check the Performance Counter checkbox.
10: Click Next.

11: Click the Add button.

12: In the list of instances, select .
13: Click the Add button to add the counters to the list of added counters.
14: Select from the list of instances.
15: Click Add.
16: Expand Process from the list of counters. (Make sure you expand Process and not Processor)

17: Select % Processor Time from the Process object.
18: Select from the list of instances.
19: Click Add.
20: Expand Thread from the list of counters.
21: Select % Processor Time from the Thread object.
22: Select from the list of instances.
23: Click Add.
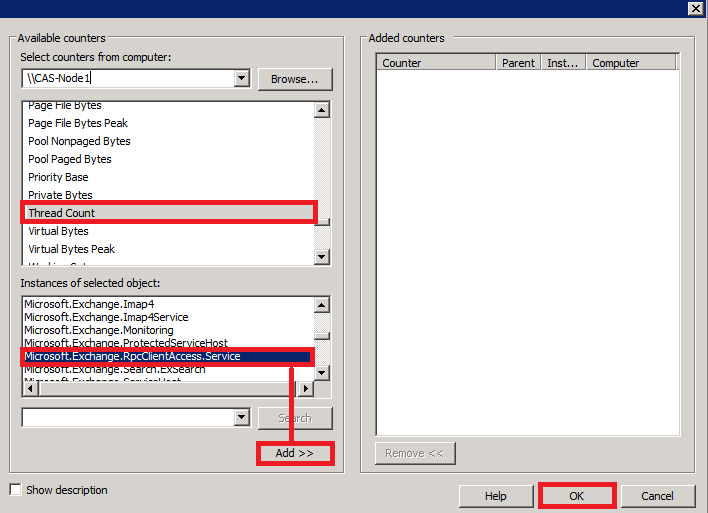
Note: Here I’m taking instance as “MSExchRpcClientServive“, please select the Instances based on your requirement.
24: Select ID Thread from the list of instances.
25: Click Add.
Click the OK button and then the Next button. Make note of where the data collector set is being saved. (You can change this location if you need to.) Then click on Finish.
The data collector set is not yet running. To start it, right-click on High CPU under the User Defined node and select Start from the menu.
The above steps are to show the collecting the Performance Counters.
Now let’s see how to pull the dump and Analyze
Creating a Debug Diagnostics Rule :
Download the tool in the Server that you planning to take the dumps for the stats using the Tool shown below:
Install the tool on your server and run it.
When you run this tool, it will display the Select Rule Type dialog.
Follow these steps to create a crash rule for the service or Instance that you take the Report dump.
1: Select Performance and click Next.
2: Select Performance Counters and click Next.
3: Click Add Performance Triggers.
4: Expand the Processor (not the Process) object and select % Processor Time.
Note : If you are on Windows Server 2008 R2 and you have more than 64 processors, please choose the Processor Information object instead of the Processor object.)
5: In the list of instances, select _Total.
6: Click Add and then click OK, select the newly added trigger and click Edit thresholds.
7: Select Above in the dropdown.
8: Change the threshold to 80.
9: Enter 30 for the number of seconds.
Note: You can adjust this value if needed, but be careful not to specify a small number of seconds in order to prevent false triggers.
10: Click OK -> Next -> Add dump target.
11: Select Web Application Pool from the dropdown and select your application pool from the list of app pools.
12: Click OK -> Next -> Next
Enter a name for your rule if you wish and make note of the location where the dumps will be saved. You can change this location if desired.
13: Click Next.
14: Select Activate the Rule Now and click Finish.
This rule will create 11 dump files. The first 10 will be “mini dumps” which will be fairly small in size. The final dump will be a dump with full memory, and that dumps will be much larger.
Once the high CPU problem has occurred, you will want to stop the Performance data collector set from collecting data. To do that, right-click on the High CPU data collector set listed under the User Defined node and select Stop.
Note : For Collecting the Performance logs we need to ADD Process and for analyzing need to add Processor.
For more info: http://blogs.technet.com/b/marcelofartura/archive/2006/09/15/456363.aspx
Praveen Kumar
MCTS | Exchange Server
Publisher @ Techrid.com
